
Introduction to the Universe of Agile Metrics
In software development and modern project management, agility has become a market standard. However, being agile doesn't just mean delivering fast; it means delivering value in a predictable, sustainable, and continuous way. It is exactly in this scenario that agile metrics come into play.
They act as the dashboard of a high-performance vehicle, indicating speed, fuel consumption, engine stability, and the correct direction. Without clear metrics, teams make decisions based exclusively on feelings and hunches (the famous "guesswork"), which drastically compromises the predictability of deliveries and prevents the continuous improvement of structured processes.
Quantitative vs. Qualitative Metrics
What are Quantitative Metrics?
Quantitative metrics focus on raw and objective numerical data that can be measured directly and without ambiguity. They answer crucial questions for the business's technical planning, such as:
These metrics are essential for establishing consistent performance histories, calculating realistic predictability for future deliveries, and identifying statistical deviations in the production flow.
What are Qualitative Metrics?
On the other hand, qualitative metrics assess the subjective perception of value, customer satisfaction levels, and the internal health of the development team. They help us investigate the real causes behind the numerical data.
Common examples include climate surveys (Team Morale), customer satisfaction indexes such as the Net Promoter Score (NPS), and periodic assessments of code architecture quality. Finding the perfect balance between the quantitative and qualitative perspective is the great secret to creating high-performing teams and fully satisfied customers.
The Main Flow and Capacity Indicators
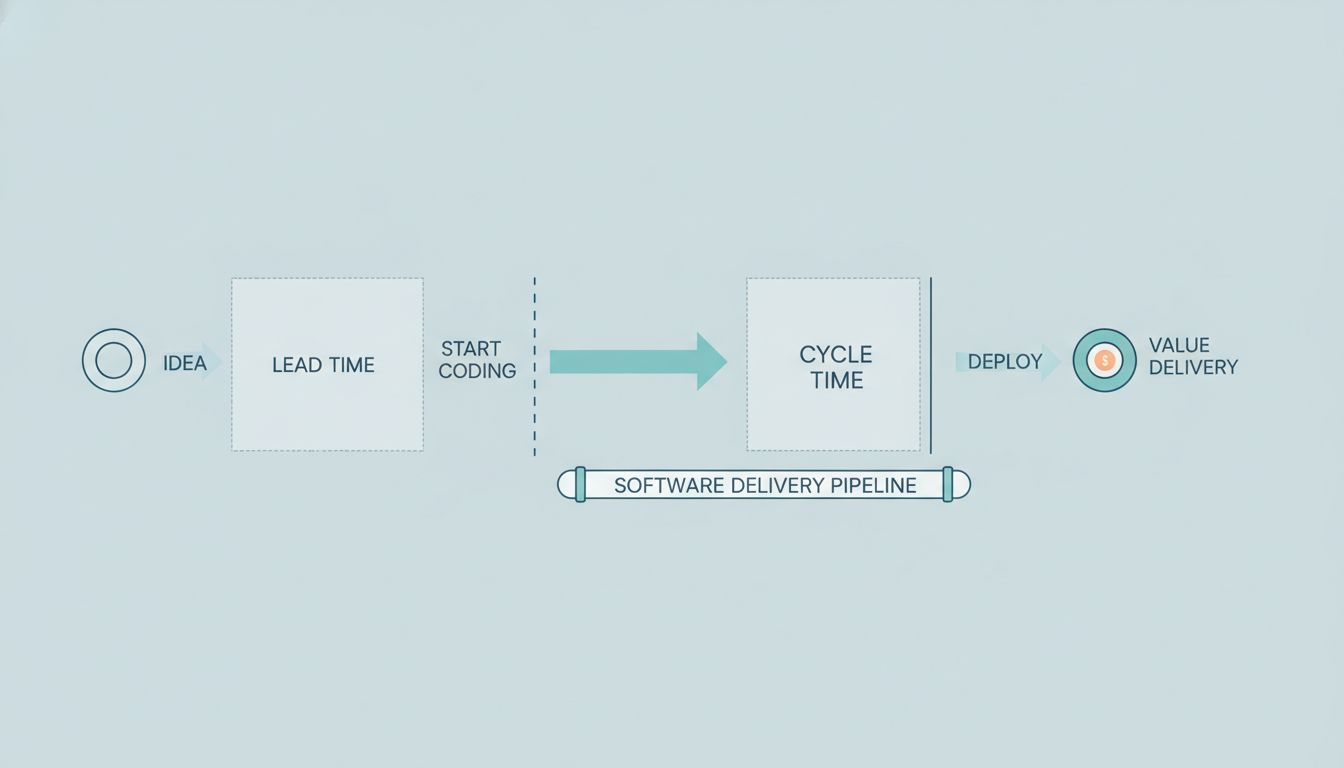
To manage the end-to-end delivery flow intelligently, five flow and capacity metrics must be mastered by every Product Owner, Scrum Master, or Agile Coach:
Flow Health: WIP, Aging, Break-ins, and Carryovers
WIP Limits and Aging
WIP (Work in Progress) refers to the limit of active work in progress. The agile philosophy preaches the motto: "Stop starting and start finishing!". By limiting WIP, the team focuses on finishing started tasks, avoiding cognitive overload and eliminating bottlenecks more quickly.
Aging (Work Aging) monitors how long a started task has been open without being completed. It is a vital indicator for identifying blockers early, before the team's average Cycle Time is severely affected.
Interruptions (Break-ins) and Carryovers
Break-ins are the famous unplanned demands or critical urgencies (like critical production bugs) that arise and intercept the planned work cycle. Monitoring break-ins is vital to measure how much energy the team is wasting on reactiveness.
On the other hand, Carryovers are the tasks planned for a cycle (Sprint) that could not be completed in the agreed time and need to spill over to the subsequent Sprint. High carryover rates point directly to planning failures or unresolved external dependencies.
Key Charts: Burnup, Burndown, and CFD
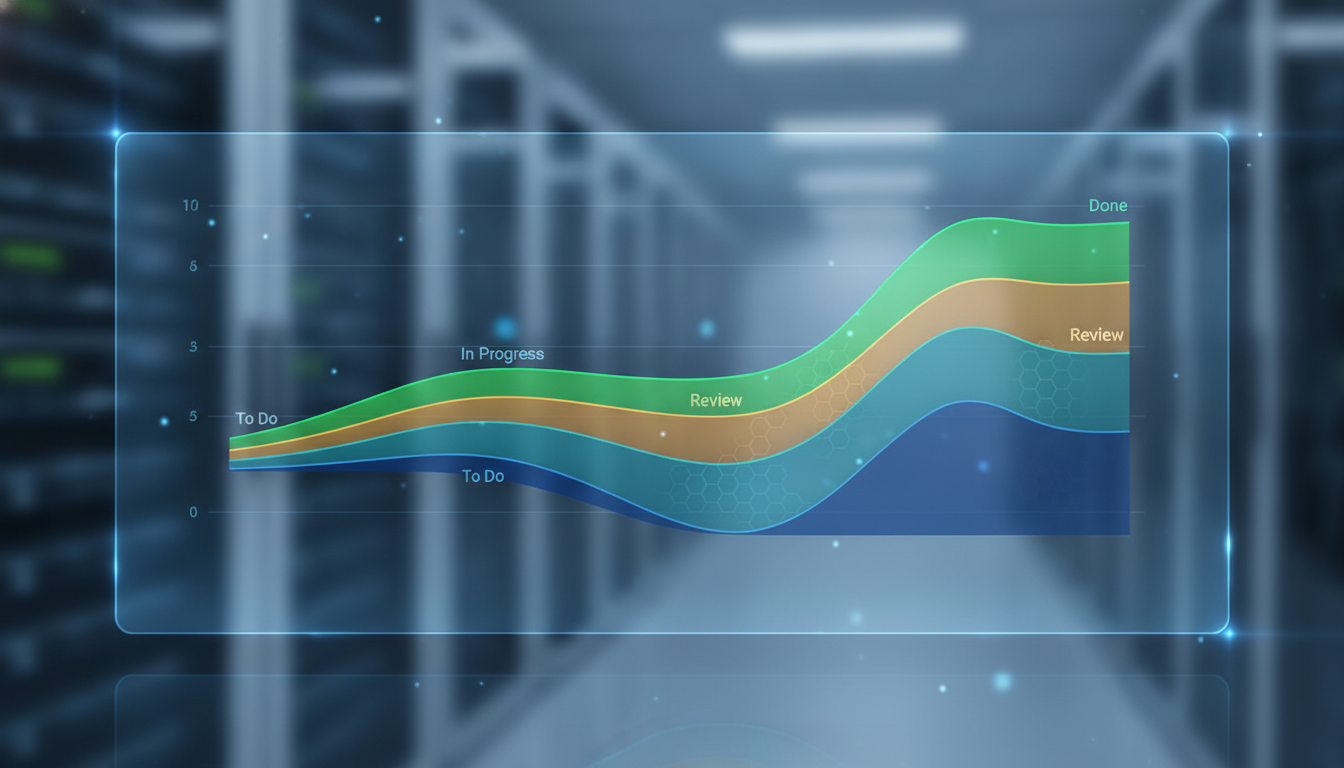
Visual management facilitates communication and ensures instant transparency about project progress:
The Most Used Management Tools
In the technology and project management market, several tools stand out for automating the extraction and plotting of these metrics charts:
The Next Step in Your Agile Career
Implementing agile metrics in your project team is not about creating mechanisms for punishment or individual productivity tracking, but rather about obtaining the analytical data necessary to foster continuous operational improvement, reduce waste, and deliver real value to the customer with maximum predictability.
If you want to master these concepts in depth, lead high-performance teams, and learn the best recommended practices in agile project management, we invite you to be part of our learning platform. Connect with active market experts and accelerate your professional career once and for all!
Frequently Asked Questions (FAQ)
1. What are Agile metrics and why are they essential for high-performing teams?
Agile metrics are standards of measurement that help teams evaluate productivity, quality, and process health throughout the software development lifecycle. They provide objective, data-driven insights that allow teams to identify bottlenecks and optimize workflows continuously. By tracking these indicators, organizations can improve predictability and deliver value to customers more efficiently.
2. What is the key difference between Lead Time and Cycle Time?
Lead Time measures the total time elapsed from the moment a request is submitted until it is fully delivered to the customer. Cycle Time tracks only the active work time spent completing the task once development actually begins. Understanding both metrics helps teams separate internal process efficiency from overall customer wait times.
3. How does a Cumulative Flow Diagram (CFD) help identify process bottlenecks?
A Cumulative Flow Diagram visually represents the status of work items across different workflow stages over time. Widening bands on the diagram signal accumulating Work in Progress (WIP) and highlight specific stages where work is stalling. Monitoring these visual patterns enables managers to quickly address capacity issues and stabilize workflow.
4. Which Agile metrics best measure team productivity without compromising quality?
Teams should balance throughput metrics like Velocity and Cycle Time with quality indicators such as Defect Density and Escaped Defects. Focusing solely on speed can incentivize rushed work, while combining speed and quality metrics ensures sustainable high performance. Tracking customer satisfaction alongside delivery speed ensures value alignment with business goals.
5. How can teams start implementing Agile metrics without overwhelming developers?
Begin by selecting two or three essential core metrics, such as Cycle Time and Work in Progress (WIP) limits, rather than tracking everything at once. Focus on using the data for continuous team improvement rather than individual performance evaluation. Automating data collection through modern project management tools keeps administrative overhead minimal for developers.